Photo or Computer graphics: The survey evaluation
In the past decade computer graphics have reached a level of realism that makes it hard to distinguish them from actual photos. That is obviously pretty cool. The technological advancements have enabled artists to create amazing artwork and realize their creative vision. We are now as close as never before to visualize anything you can imagine.
However truly photo-realistic cg images also come with some risks. If you can’t tell a photo from a cg image that opens the door for all kinds of forgery and manipulation.
As part of my studies I am doing a project on “distinguishing between photos and computer graphics using neural networks”. I am building and training a machine learning model to classify input images as either photo or computer graphics. To evaluate the results in a meaningful way I needed something to compare against. Therefore i conducted a small study asking people to classify a selection of 49 photos and computer graphics images. The cg images were collected from Artstation.com while photos were found on Pixabay.com. I also collected some information about the participants’ background.
To reach a wider audience I used the opportunity to quickly present during the open-stage session at Blender Conference 2018. I described my project and asked for participation in the survey.
The study is now over and here are the results:
In total I got 2359 responses. The following is my evaluation of the survey. At the bottom of the page you can find links to the raw data licensed under ODC-BY, the evaluation scripts I used as well as the custom survey software.
How often do you use 3D-graphics-software (Blender, UE4, Modo, ZBrush, etc…)?
Possible answers were: Never, Once a month, Once a week, Multiple times a week, Everyday.
The results show that the participants that have never used 3D-graphics-software are almost as well represented as users of 3D-graphics-software. This allows meaningful analysis of both groups.
How much time do you spend per week playing computer/console games?
Possible answers were: less than 1h, 1-3h, 3-6h, 6-12h, more than 12h
Again participants that play many and few games are well represented.
The interesting part
After those general questions the main part of the survey began. Each image was shown individually in a random order. Once the participant selected the category (cg or photo) the next image was shown. No results were shown in between to not influence the decision based on past results. A “back”-button was not provided.
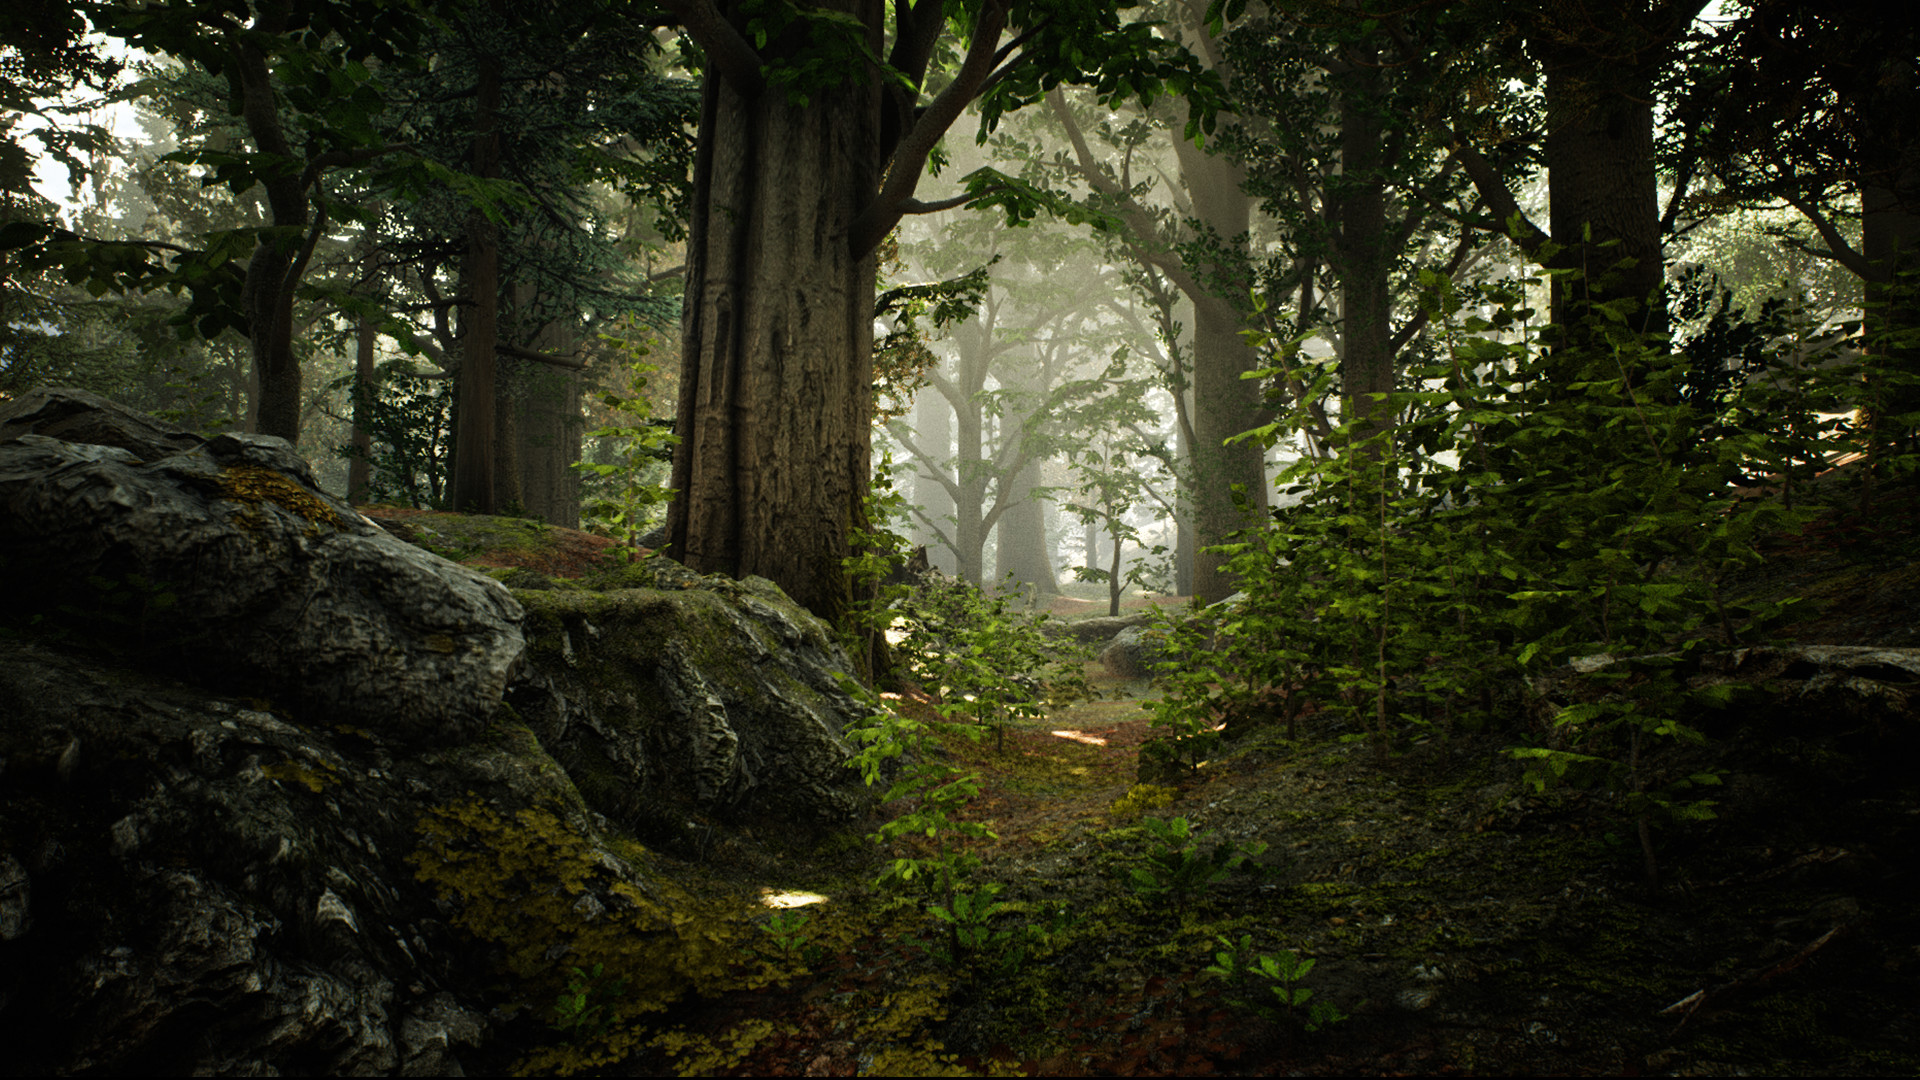
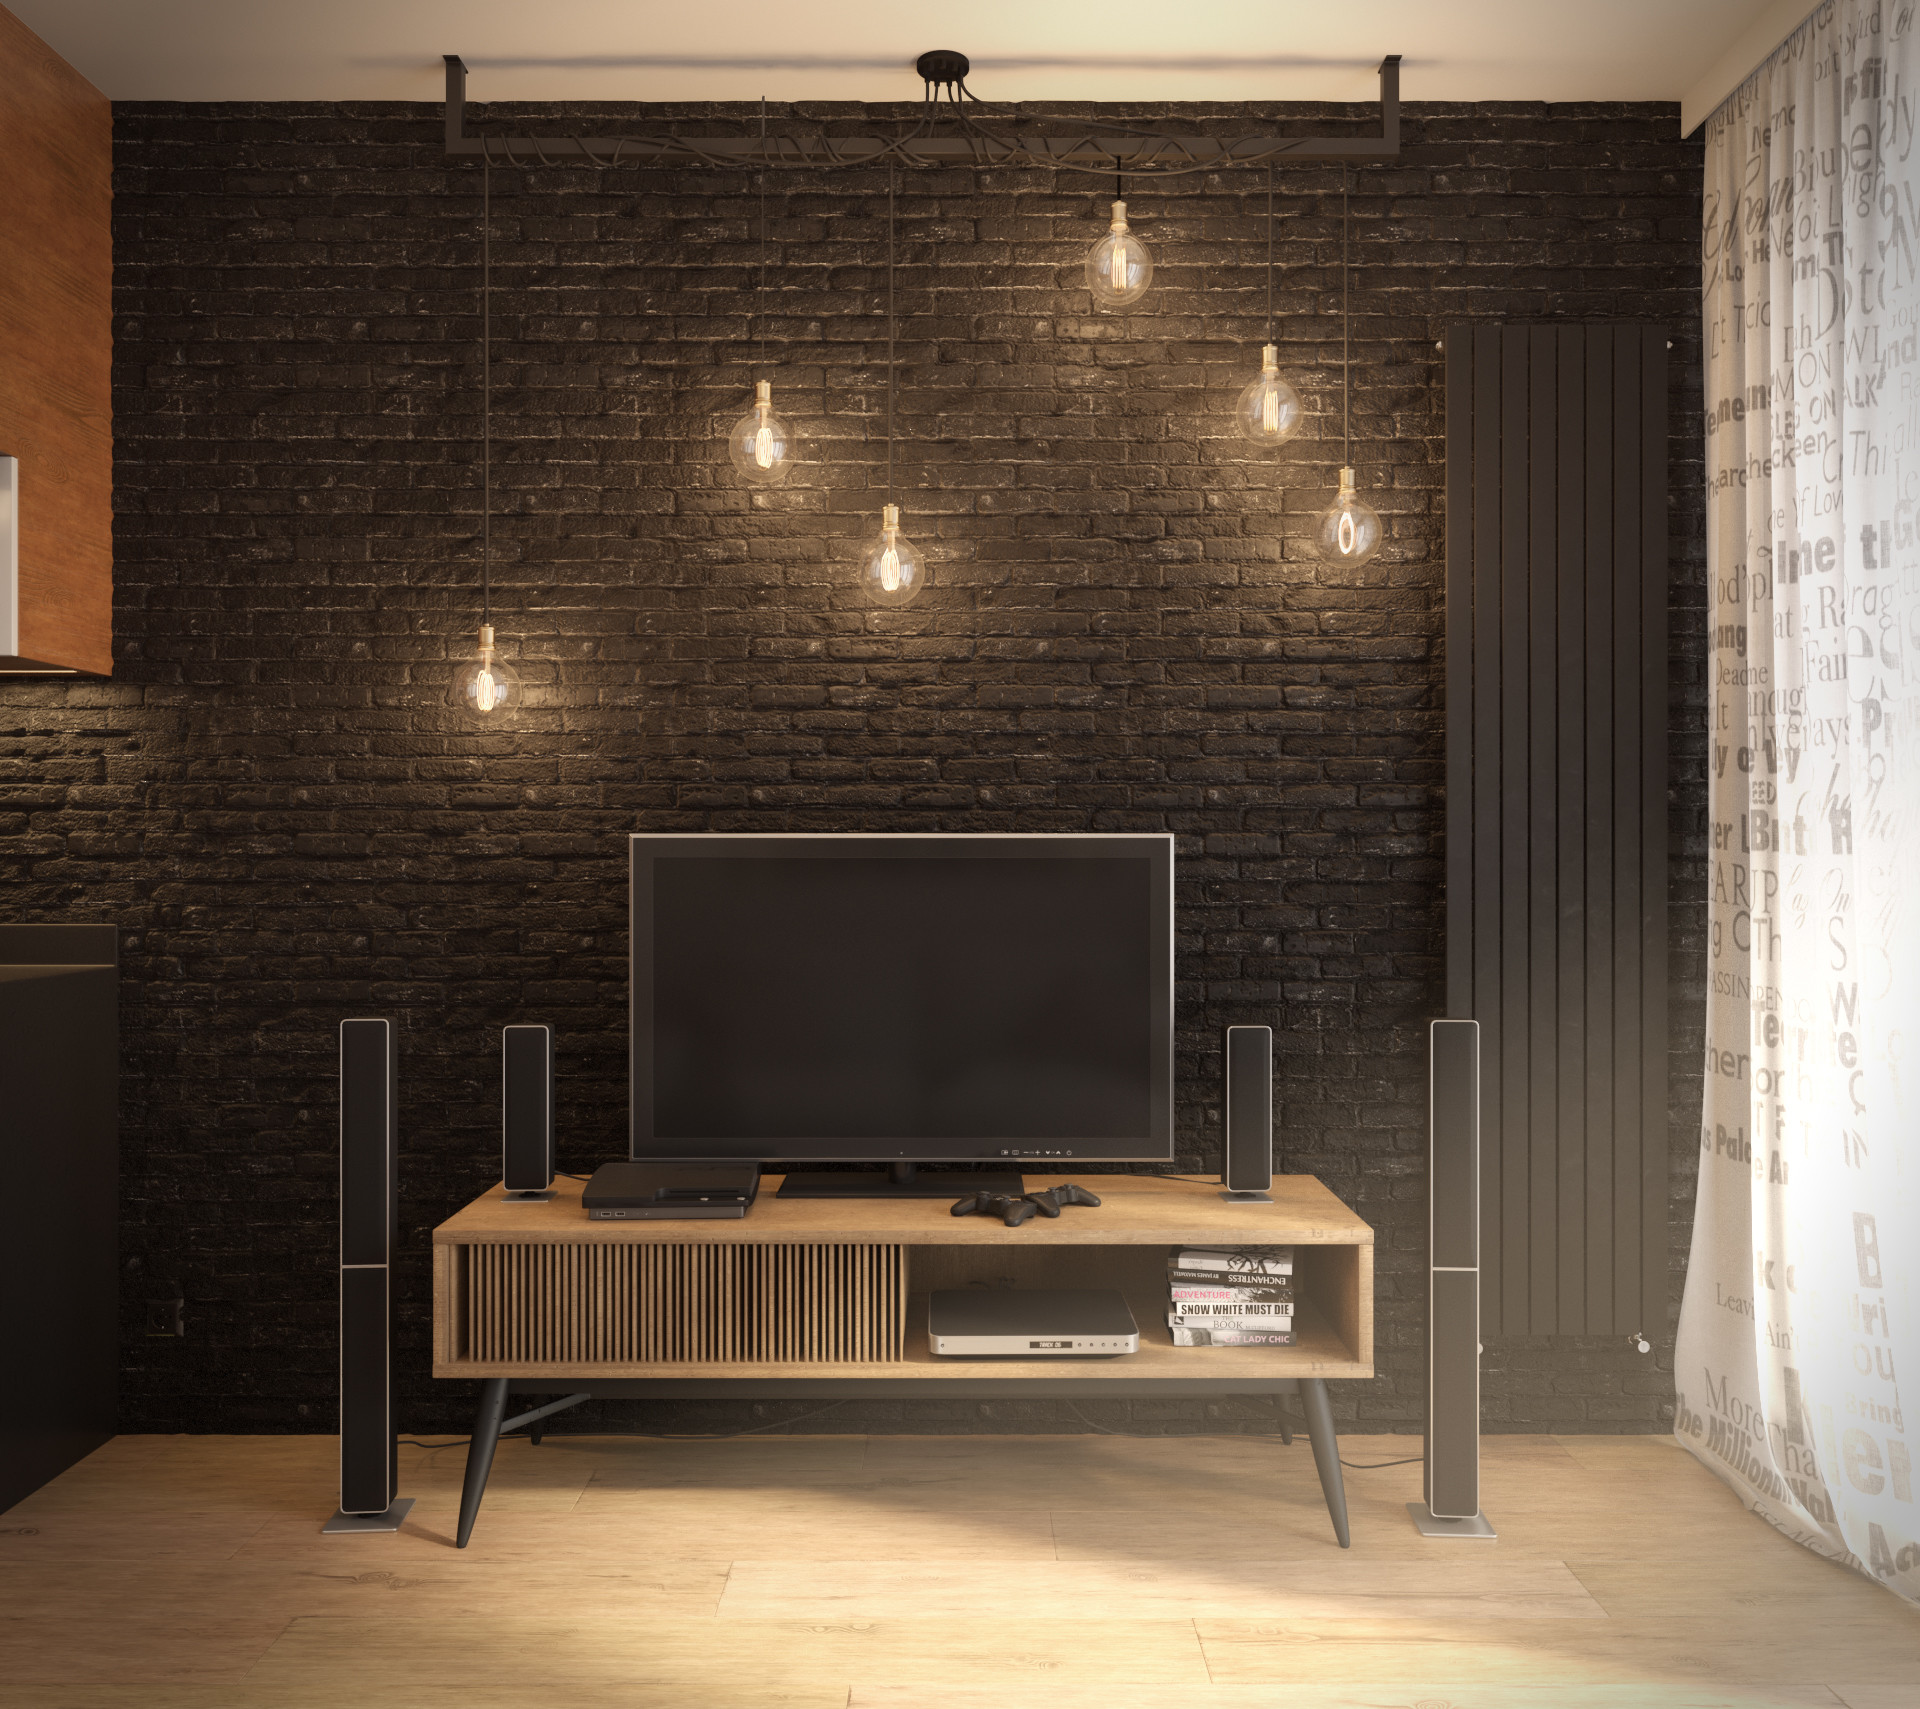
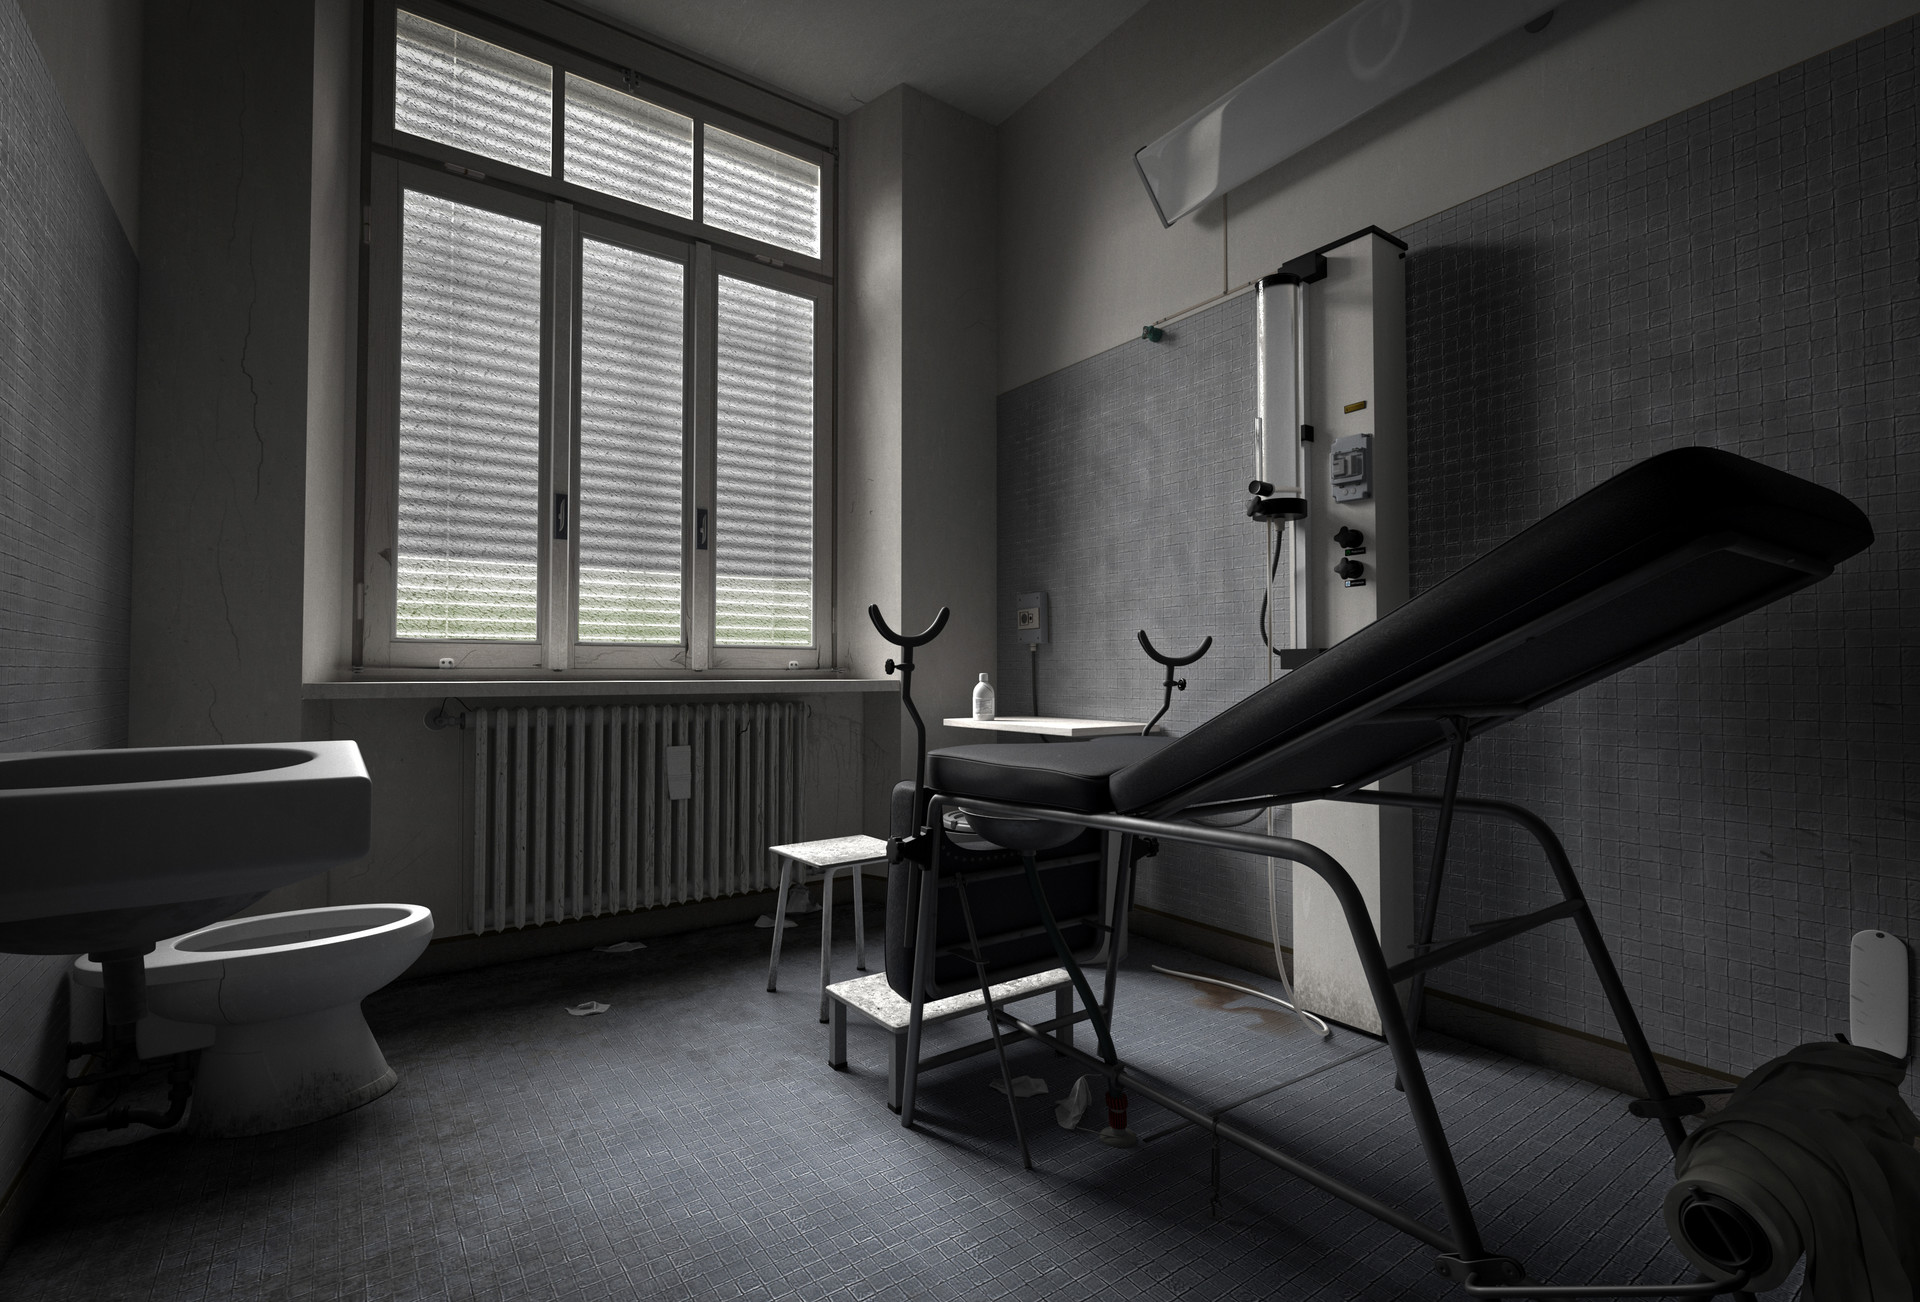
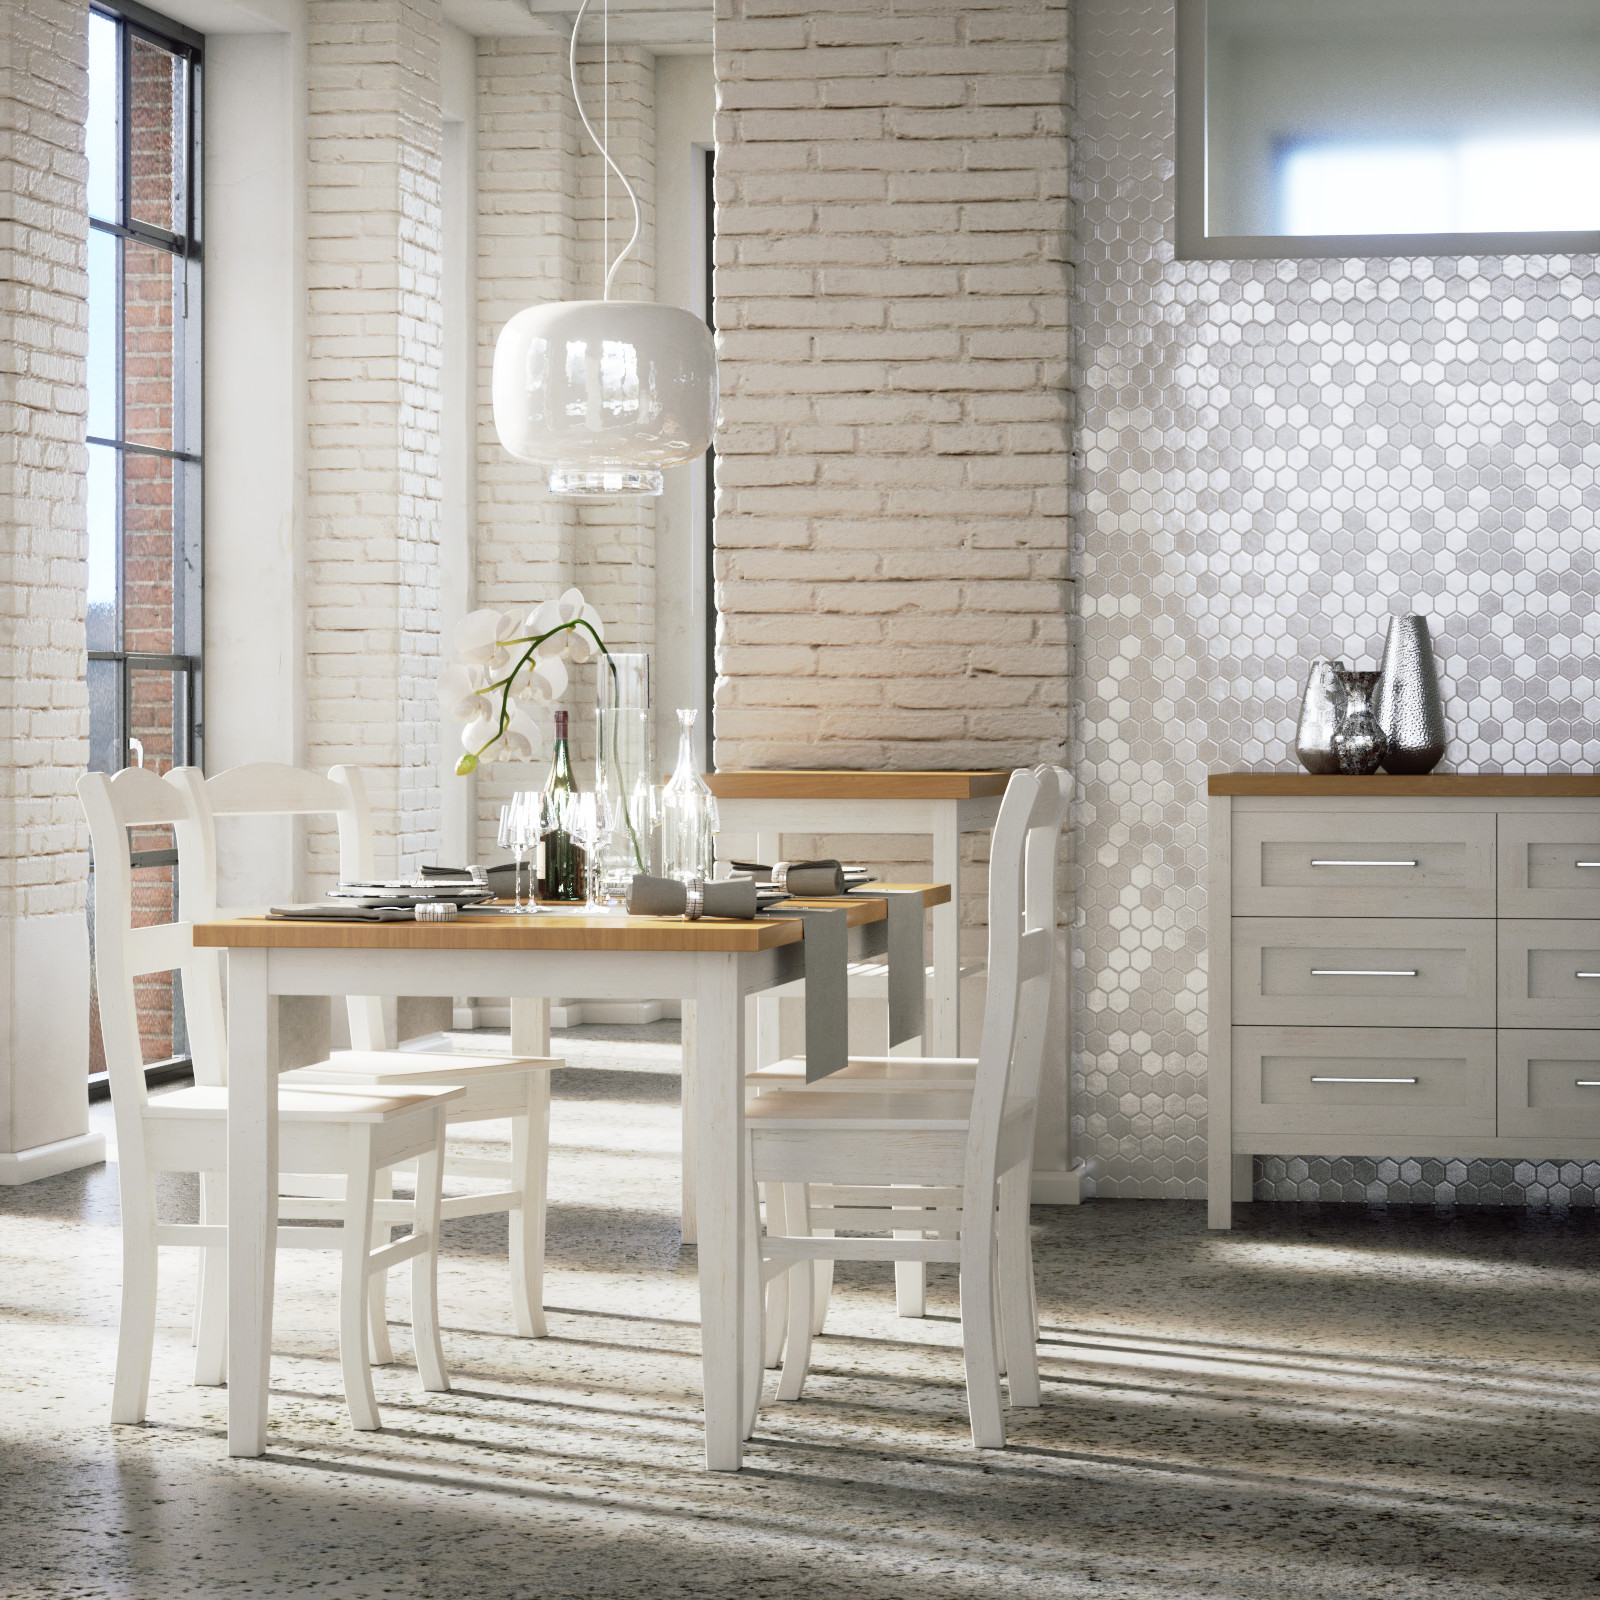
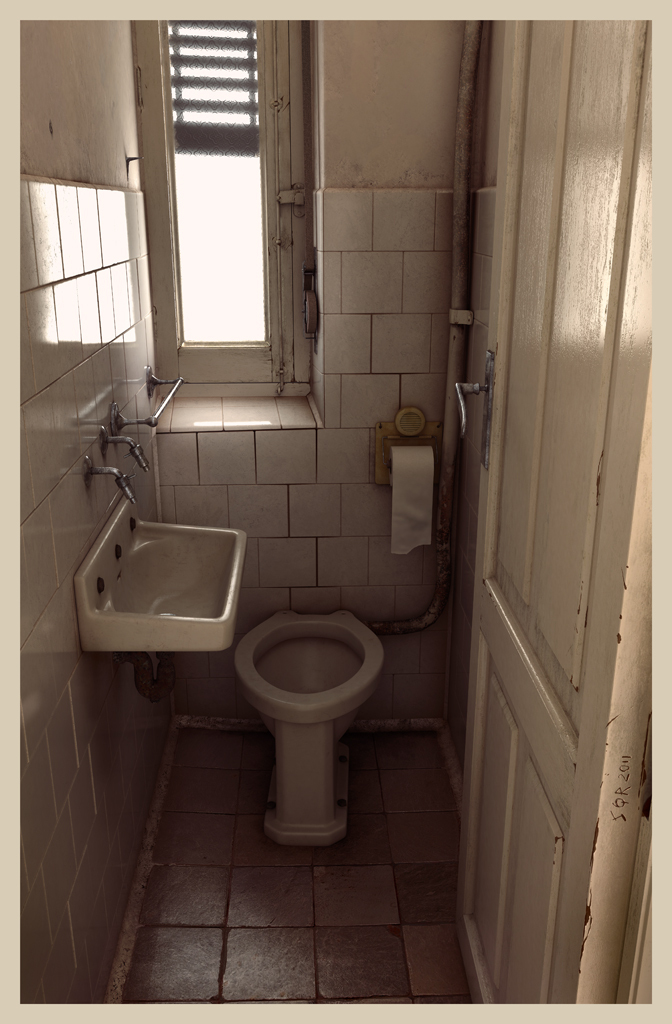
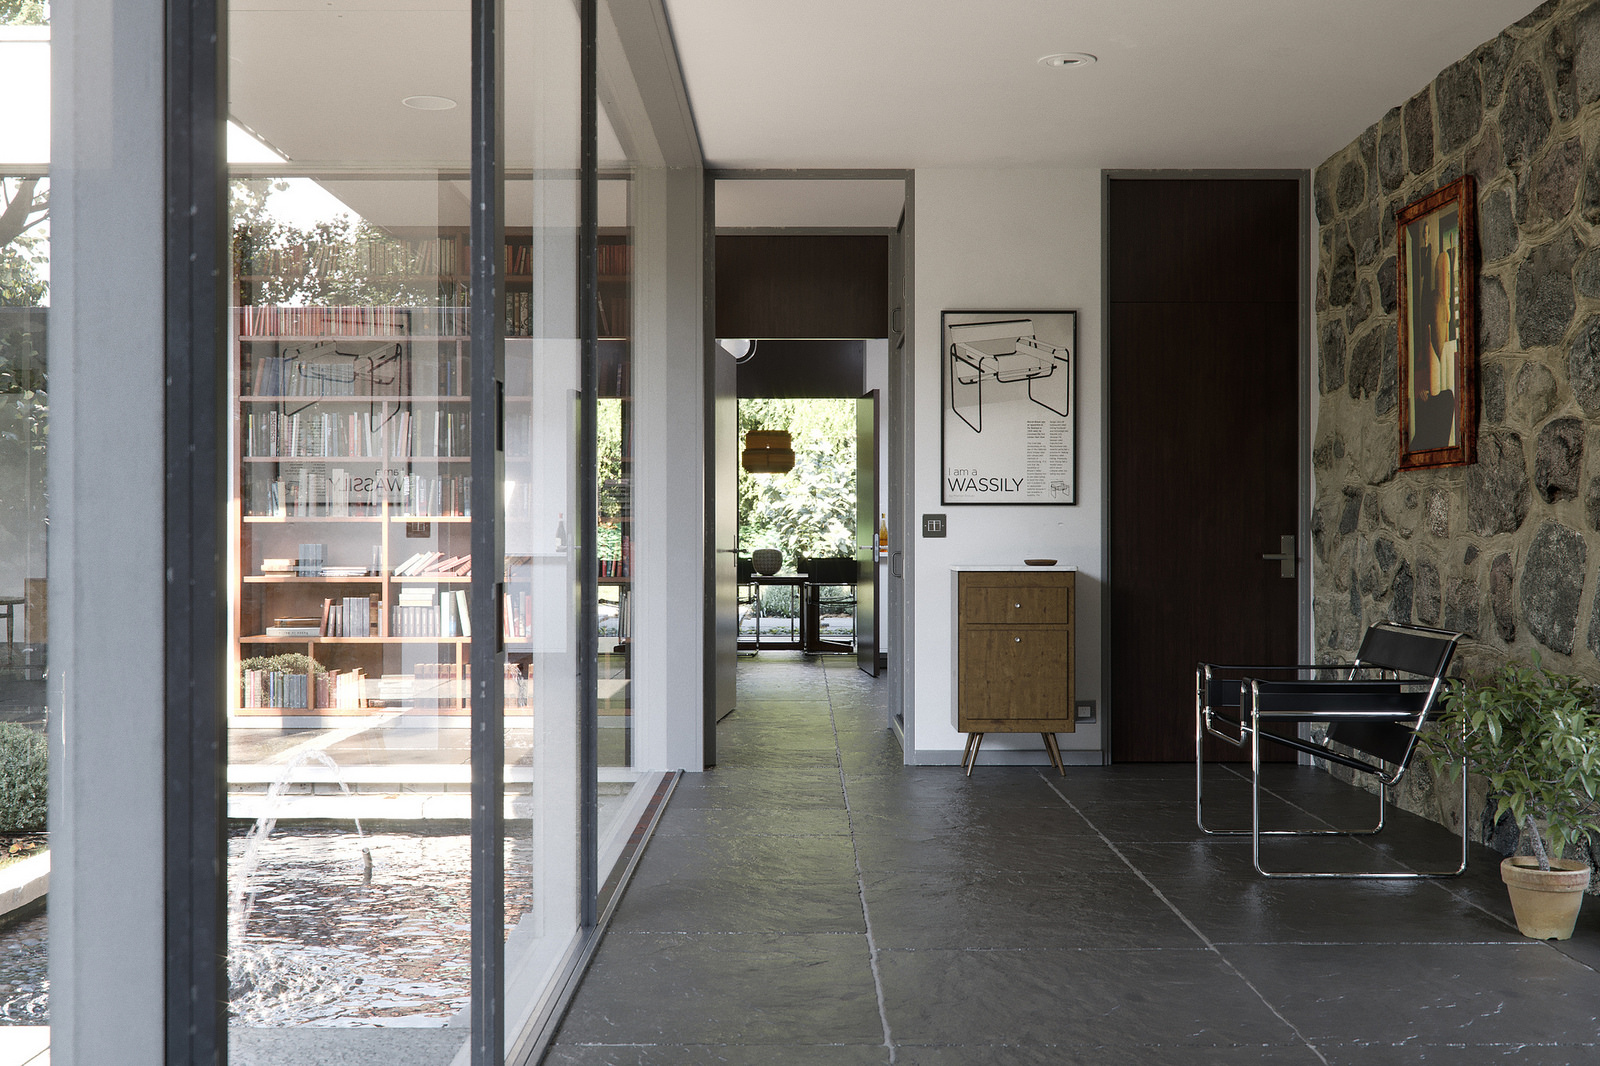
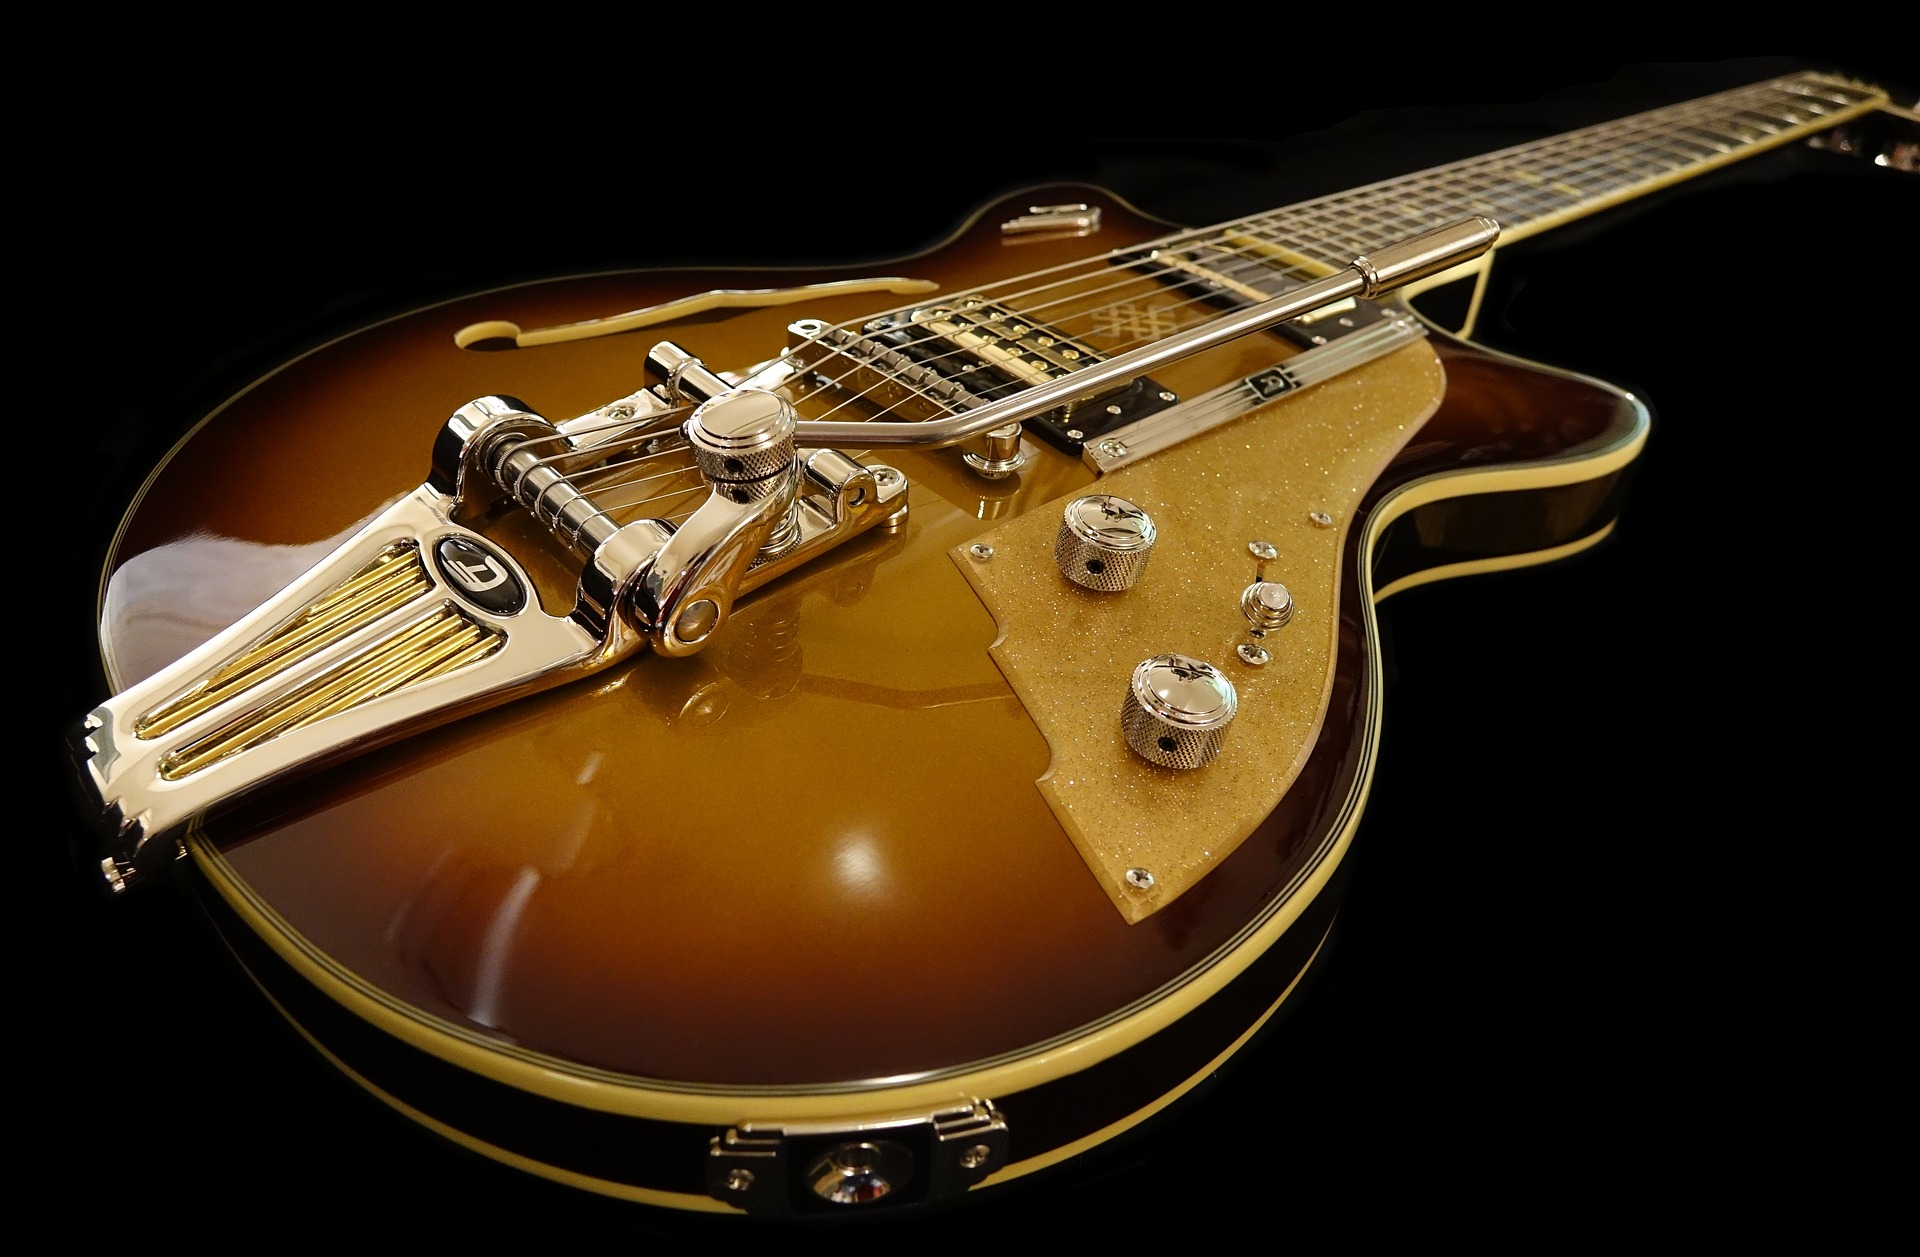
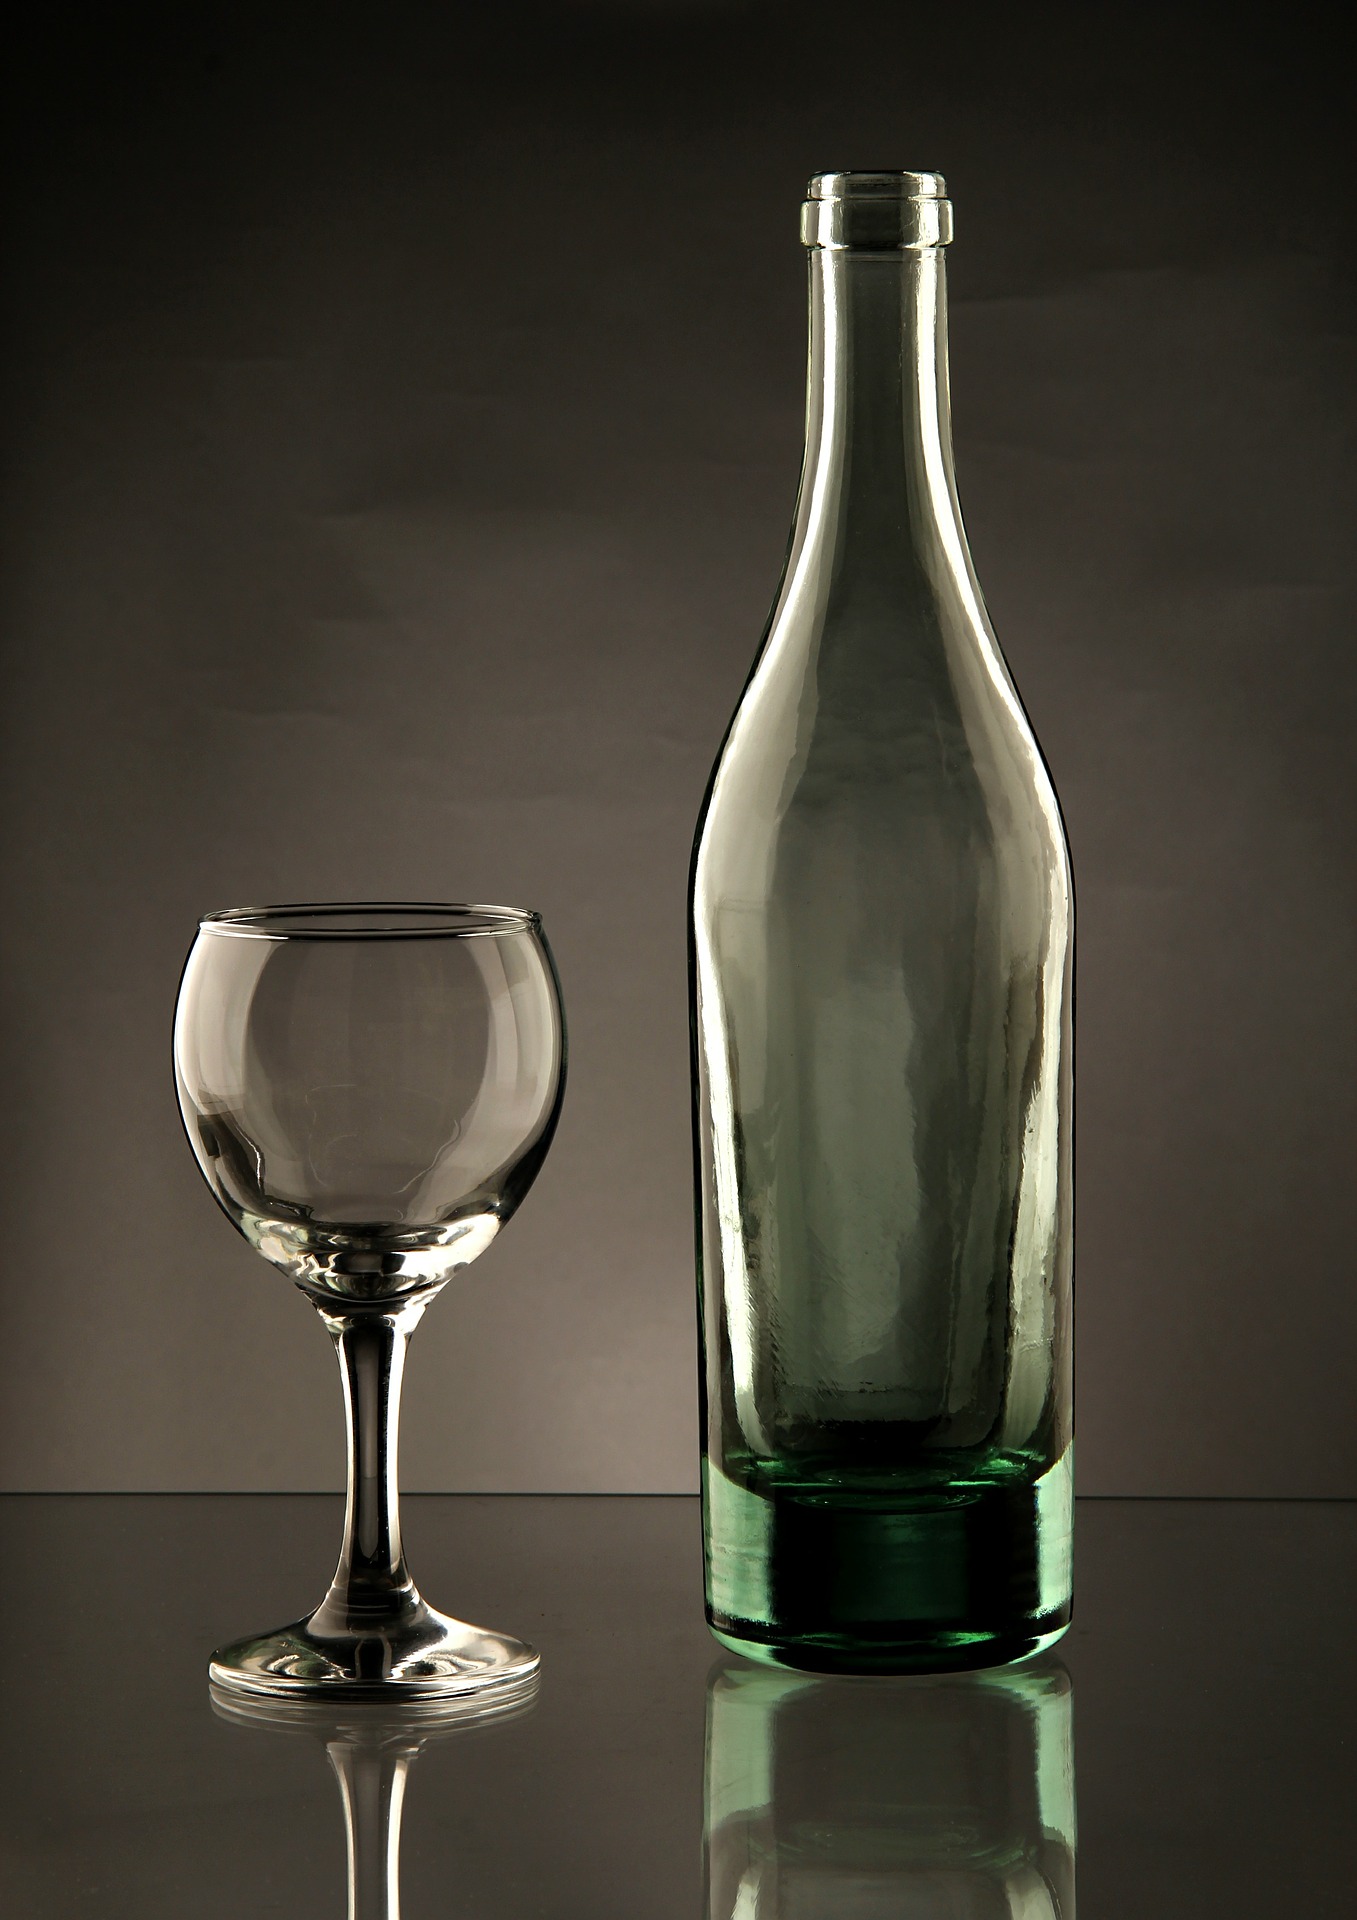
The following shows each image, the correct label and the percentage of participants that classified it correctly. You can click on the images to enlarge them.


Overall 62.40% of the images were classified correctly. The participant with the best result classified 100% of the images correctly while the minimum was 26.53%. As 25 out of the 49 images are cg images the expected result with random guessing is 50%. Figure 3 shows a histogram of the accuracy over all participants.
Figure 4 shows the accuracy based on the time spent using 3D-graphics software. It can be seen that people who use 3D-graphics software on a daily basis classified the images about 8% more accurately than people who have never used 3D-graphics software. This might suggests that the ability to distinguish between photos and cg images is to some extent learnable.
Plotting the accuracy based on the time spent playing video games does not show an obvious correlation (Figure 5).
Another interesting evaluation is to see if participants tend to wrongly classify cg as photo or photo as cg. Figure 6 shows the classification accuracy separately for photo and cg images.
CG
photo
It can be seen that participants were slightly better at classifying the photos but not by a significant margin.
For each image the time it took to decide was also stored. As the survey was not done in a controlled environment these results should be taken with a grain of salt.
That said Figure 7 shows the accuracy based on the average time spent per image. The chart is limited to 120s. All higher values have been cut off. It can be seen that neither deciding instantly nor taken too long yields better results.
Final thoughts
Distinguishing between photos and cg images can be pretty difficult. The result of only 58.67% accuracy for the non-3D-graphics-software users suggests that for the untrained eye it is basically impossible.
Regular users 3D-graphics-software got better results than participants that had never used 3D-graphics-software. It would be interesting to find out whether this is specific to 3D-graphics-software or applies to other visual/artistic tasks like painting.
Something that was not covered by this study is the resolution and size at which the images were shown. It is likely that part of the participants viewed the images on a small mobile device and part on a larger screen. It is possible (even likely) that this also influences the results.
The more time you spend with the data the more creative ideas come to mind. And there is a lot more to be discovered.
After the survey had opened I started working on a machine learning model to distinguish photo from cg. While some initial results look promising there are still improvements to make. So stay tuned for the results of my neural network and a full comparison.
Links
The raw data
The data was collected between the October 25th 2018 and January 16th 2019. It is licensed under the Open Database License with Attribution (ODC-By). For more information see the attached license.txt
Details about the schema can be found in schema.txt
The images are not part of the data-set and not licensed under ODC-By. Instead all rights belong to the respective authors. All images were used with permission.
<a class="download-link" title="Version 1.0" href="https://oweissbarth.de/download/1352/" rel="nofollow"> Photo or CG Survey Raw data (348 downloads) </a>
Evaluation scripts
The scripts used to generate the above evaluations can be found here.
Survey software
The software that was used to run the survey is custom and can be found here. This was developed more or less in a single day. It is very purpose-built (read hacky)